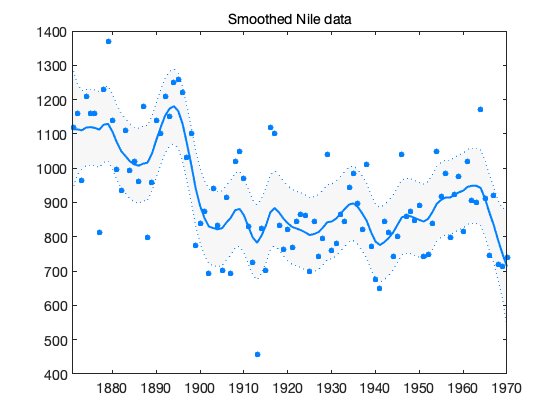
Classical Nile data
Here we fit the classical Nile river flow data
y = [1120 1160  963 1210 1160 1160  813 1230 1370 1140  995  935 ...
     1110  994 1020  960 1180  799  958 1140 1100 1210 1150 1250 ...
     1260 1220 1030 1100  774  840  874  694  940  833  701  916 ...
     692 1020 1050  969  831 726  456  824  702 1120 1100  832  764 ...
     821  768  845 864  862 698  845  744  796 1040  759  781  865 ...
     845  944  984  897  822 1010  771  676  649  846  812  742  801 ...
     1040  860  874 848  890  744  749  838 1050  918  986  797  923 ...
     975  815 1020  906  901 1170  912  746  919  718  714  740]';

t = (1871:1970)'; % time
Observation and model errors match those in Petris et al. (2009)
s = sqrt(15100);
w = sqrt([755 755]);
Fit the DLM model
out = dlmfit(y,s,w);
figure(3);
dlmplotfit(out,t);
title('Smoothed Nile data')
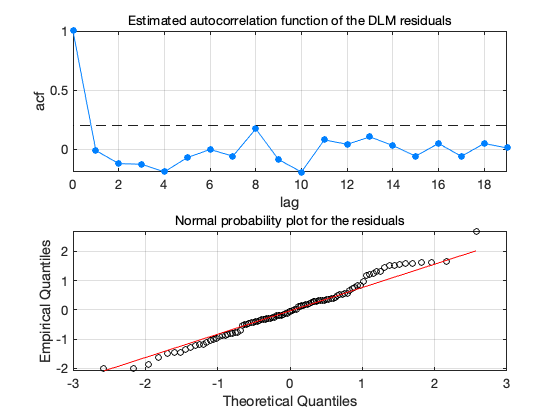
figure(2);
dlmplotdiag(out,t);